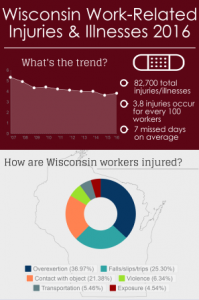
According to estimates from the U.S. Bureau of Labor Statistics’ (BLS) Survey of Occupational Injuries and Illnesses (SOII), there were 82,700 total injuries and illnesses reported by Wisconsin employers in 2016, an increase from the 78,800 total injuries and illnesses reported for 2015. The rate of injury and illness rose from 3.6 in 2015 to 3.8 cases per 100 equivalent full-time workers. Nationally, the total recordable case rate declined from 3.3 to 3.2 cases per 100 full-time workers.
Background
SOII is the largest work injury data survey conducted nationwide. The Wisconsin BLS program collects data annually from a representative sample of 6,000 establishments, with a 97% survey response rate.
Summary Key Findings:*
- Private industry incident rate increased from 3.6 to 3.7. State and local government total incident rate decreased from 4.2 to 4.1. (See Chart 1)
- Manufacturing, professional and business services, and state and local government sectors show declines in rates from the prior year, while all other industries remained constant or showed increased rates. (See Chart 2)
- The number of cases increased across summary case types from 2015 to 2016 with the exception of job transfer or restriction cases: cases with days away, job transfer, or restriction (DART) increased from 39,600 to 41,800; cases with days away from work (DAFW) from 21,800 to 24,300; other recordable cases (ORC) from 39,200 to 40,800. Cases with job transfer or restriction (DJTR) only fell slightly from 17,800 to 17,500.
- Public sector sub-industries with the highest injury rates include: Local government Heavy and civil engineering construction (11.3), Local government Utilities (7.7), and Local government Transit and ground passenger transportation (6.9). (See Chart 3)
- Private sector sub-industries with the highest injury rates include: Leather and allied product manufacturing (11.8), Couriers and messengers (7.4), and Construction of buildings (7.0). (See Chart 3)
*For charts and tables of Wisconsin data, including case and demographic profiles, go to www.slh.wisc.edu/bls.