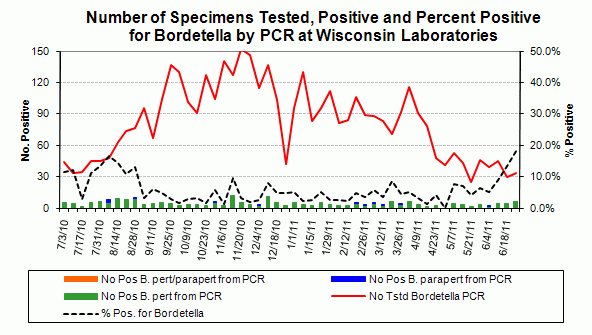
Bordetella pertussis/parapertussis Activity
Limitations of Data
2010-2011 Bordetella pertussis/parapertussis Activity
About Bordetella pertussis

Limitations:
- The data displayed in this graph are laboratory test data and do not represent physician diagnoses. As such, the data can be utilized to illustrate trends in the activity of this agent. No conclusions as to the total number of cases of illness which occurred can be drawn from this data, due to variations in patterns of specimen submission and testing.
- The data displayed in this graph were reported on a voluntary basis by Wisconsin laboratories and test sites.
- Note that scales may vary between graphs and during the season.
